Confidential — Strategic Partnership Deck
February 2026
🇺🇸 EN 🇨🇳 中文

The data layer
for vagus nerve stimulation

A subscription platform that measures what taVNS does to real bodies — session by session, biomarker by biomarker.

253
Active users
65K+
Vitals recorded
(Feb 2026)
308%
MoM data growth
01

What data is worth

The lesson every hardware company learns too late

The Oura Story

Same ring. What changed was data + subscription.

2020
$20M
2021
$5.99/mo
2022
$2.55B
2024
$5.2B
2025
$11B

Oura's hardware barely changed. Subscription + data moved it from a $20M gadget to an $11B health platform in 5 years.

The Multiples Gap

1–4×
Hardware
(one-off sales)
5–15×
Subscription
+ data
10.4×
Oura
(hw + subscription)

Sources: Aventis Advisors, Esinli Capital, SaaS Capital, Sacra ($5.2B ÷ $500M)

yōjō today

Combines taVNS hardware with a biofeedback app, personal coaching, and a growing consumer dataset — measuring what happens in real bodies, session by session. The subscription + data layer for vagus nerve stimulation is live, not planned.

02

Is it working?

Measured outcomes across 6 conditions — from 253 real users

Causation proof

James — Accidental Crossover Trial

James's device stopped working while awaiting a replacement. He didn't immediately notice — until the data told the story.

With yōjō
~40 ms
HRV (RMSSD)
60–70+
Parasympathetic
Device broken
19 ms
HRV −53%
~20
Parasympathetic crashed
After restart
~40 ms
HRV recovered
60–70+
Parasympathetic restored
"It was only once I stopped using my VNS device that I started to realize how much inflammation was back in my body and how much pain I was experiencing."
— James

This isn't correlation. This is causation, measured in a single user's body.

Condition Grid

What yōjō users report — backed by biomarkers. Each condition is a future premium package at $30–50/month.

🛏 Sleep
"Sleeping 7.5–8 hrs, was under 7 with constant waking"
RHR −10 bpm · Parasympathetic 2× · Oura ring confirmed
🫄 IBS
"7 years chronic IBS. Completely symptom-free in 6 weeks. 3 months and counting."
Gut-brain axis via vagal tone improvement
⚡ Migraines
"Stopped medication — 4 weeks without. Pain less intense, recovery much faster."
RHR −10 bpm · Stress Index −50% · Parasympathetic +60%
🧘 Stress & Burnout
"Adrenal shutdown + menopause. Off all medication. I feel FANTASTIC."
Stress Index −45% · Parasympathetic 2× in 4 weeks
🩸 Blood Sugar
"Blood sugar lowered at night, no fluctuation at all"
Libre3 CGM confirmed · Stage 2 diabetic
🫁 Inflammation & Recovery
"Lost sense of smell from Covid. After 3 weeks, it returned."
HRV (SDNN) +200–300% · Parasympathetic +350–570%
Platform data velocity
65,000+
vitals recorded this month
↑ 308%

from 16,000 in January. Every session adds to a growing dataset of real-world taVNS outcomes.

03

Engagement that sticks

How 253 users compare to the brands you know

Retention: No Cliff Drop

⚠️

Critical distinction: yōjō measures completed VNS sessions (therapeutic interventions), not app opens. Industry benchmarks measure app opens only.

45%
6%
Day 30
Industry avg:
3–6%
50–75%
~0%
Week 18
Most apps:
near 0%
75–85%
Month 4
Whoop:
~50% at 18 months
yōjō (VNS sessions)
Industry avg (app opens)

T2D3 Trajectory

Assumes organic growth only — no distribution partnerships factored in.

Oct 2026
$800K
1,600 users
Oct 2027
$2.4M
×3
Oct 2028
$7.2M
×3
Oct 2029
$14.4M
×2
Oct 2030
$28.8M
×2

At 10× multiple, $7.2M ARR = $72M valuation by Oct 2028.

Sources: Amplitude (internal analytics), Statista 2024 (fitness app benchmarks), Bloomberg Jan 2026 (Oura metrics), SaaS Capital (revenue multiples). Retention measured as completed VNS sessions, not app opens. T2D3 trajectory assumes $500/user/year blended ARPU, organic growth only.
04

What the data shows

108 users. 30 days. Real HRV measurements from our platform — not surveys, not self-reports.

Key finding

Baseline HRV predicts treatment response

Users with low baseline HRV (83% of our users) show consistent improvement. Users with already-high HRV show regression. This isn't random — it's exactly what the research predicts.

HRV Percentage Change by Baseline HRV — Low HRV (90 users) vs High HRV (18 users) over 30 days
HRV % change from baseline, first 30 days. 108 users segmented by starting RMSSD. Low baseline (n=90) trends positive. High baseline (n=18) trends negative. Daily variance is expected — the directional split is the signal.
📄
Consistent with published research: Multiple studies show taVNS produces strongest HRV improvements in participants with low baseline vagal tone, while high-baseline individuals show minimal or inverse effects. yōjō's user population — people seeking help with sleep, stress, and chronic conditions — self-selects into the high-responder cohort.
Low HRV cohort — 90 users, trending positive
Low baseline HRV — 90 users (83%)
Oscillates but trends above zero. Consistent +5–20% improvement windows emerging by Day 10+. These are your stressed, symptomatic, high-need users.
High HRV cohort — 18 users, trending negative
High baseline HRV — 18 users (17%)
Predominantly below zero, spending time at −25% to −50%. Regression to mean + ceiling effect. These users are already well-regulated.
💡

Why this matters for the business

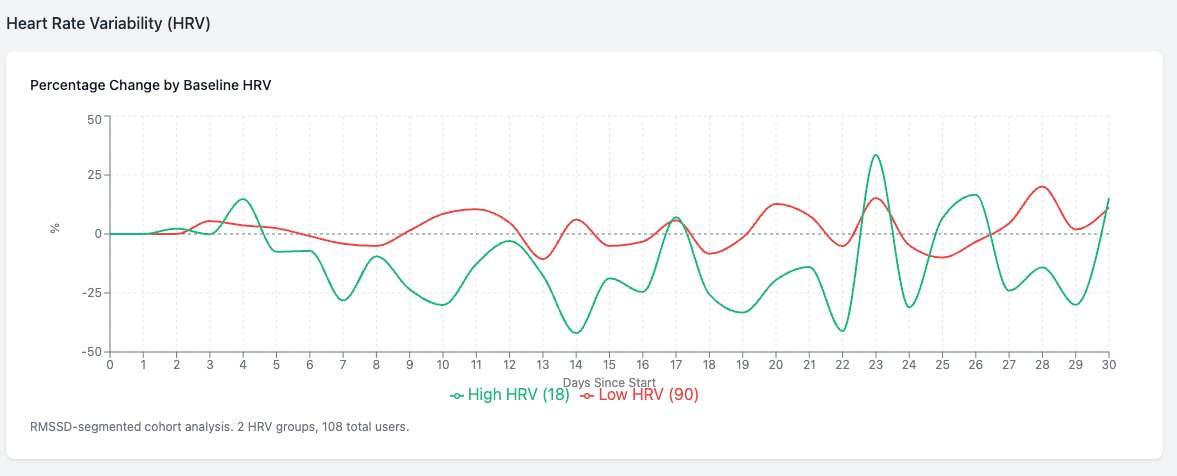
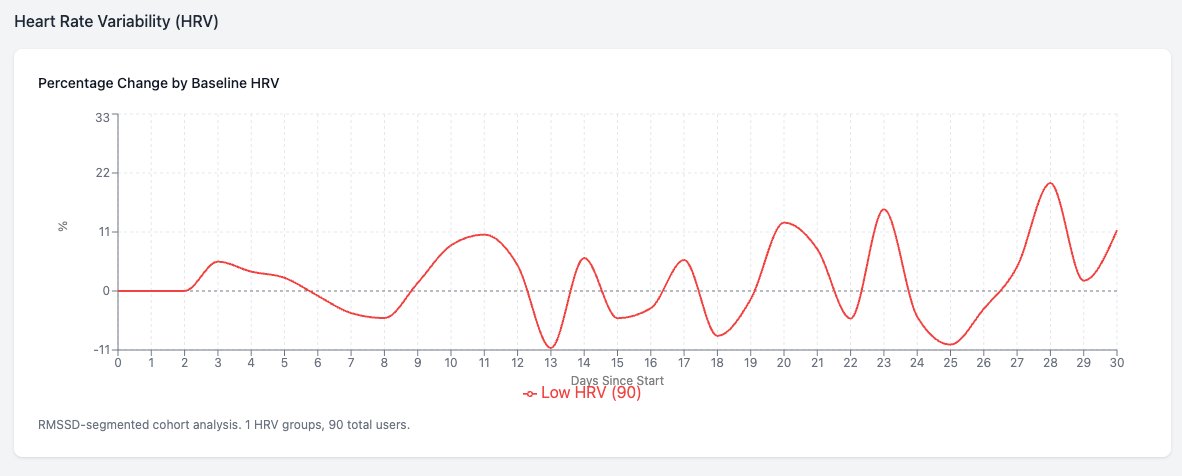
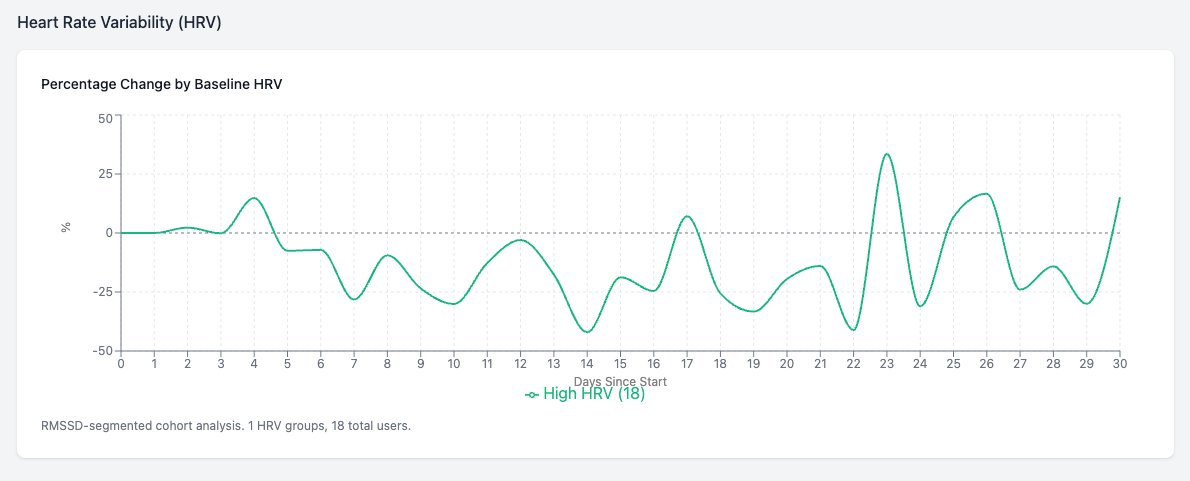
83% of yōjō users are in the cohort that responds best — because they came to us with a problem to solve. This is product-market fit measured in biomarkers, not surveys. The people who need yōjō most are the people it works best for.

Emerging signal

Age amplifies the effect

HRV Percentage Change — 65+ age group, 21 users
65+ age group — 21 users. Volatile but dramatically positive, with peaks at +20% to +40% HRV improvement. The oldest users are seeing the largest effects — consistent with age-related vagal decline creating more room for recovery.
📄
Gianlorenco et al. 2024 — "Age as an effect modifier for taVNS & HRV" identifies age as a significant moderator of taVNS response. Older participants with lower baseline vagal tone show amplified treatment effects. Our real-world data is directionally consistent.

What this means

1

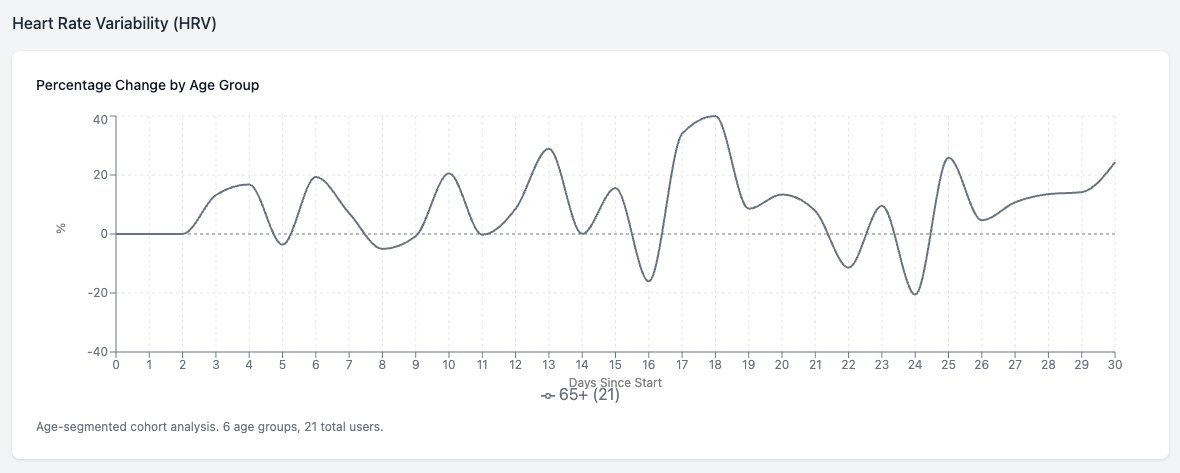
Aging populations are the fastest-growing healthcare market globally

2

Stronger response = stronger retention — users who feel real change stay subscribed

3

Future premium tier — age-optimised frequency packages at higher price points

⚠️ Small sample (21 users). Signal is directional, not statistically proven. But we're the only consumer taVNS company measuring this in real-world conditions — and every new user adds to the dataset.

Data depth per user

What we know about every person using the device

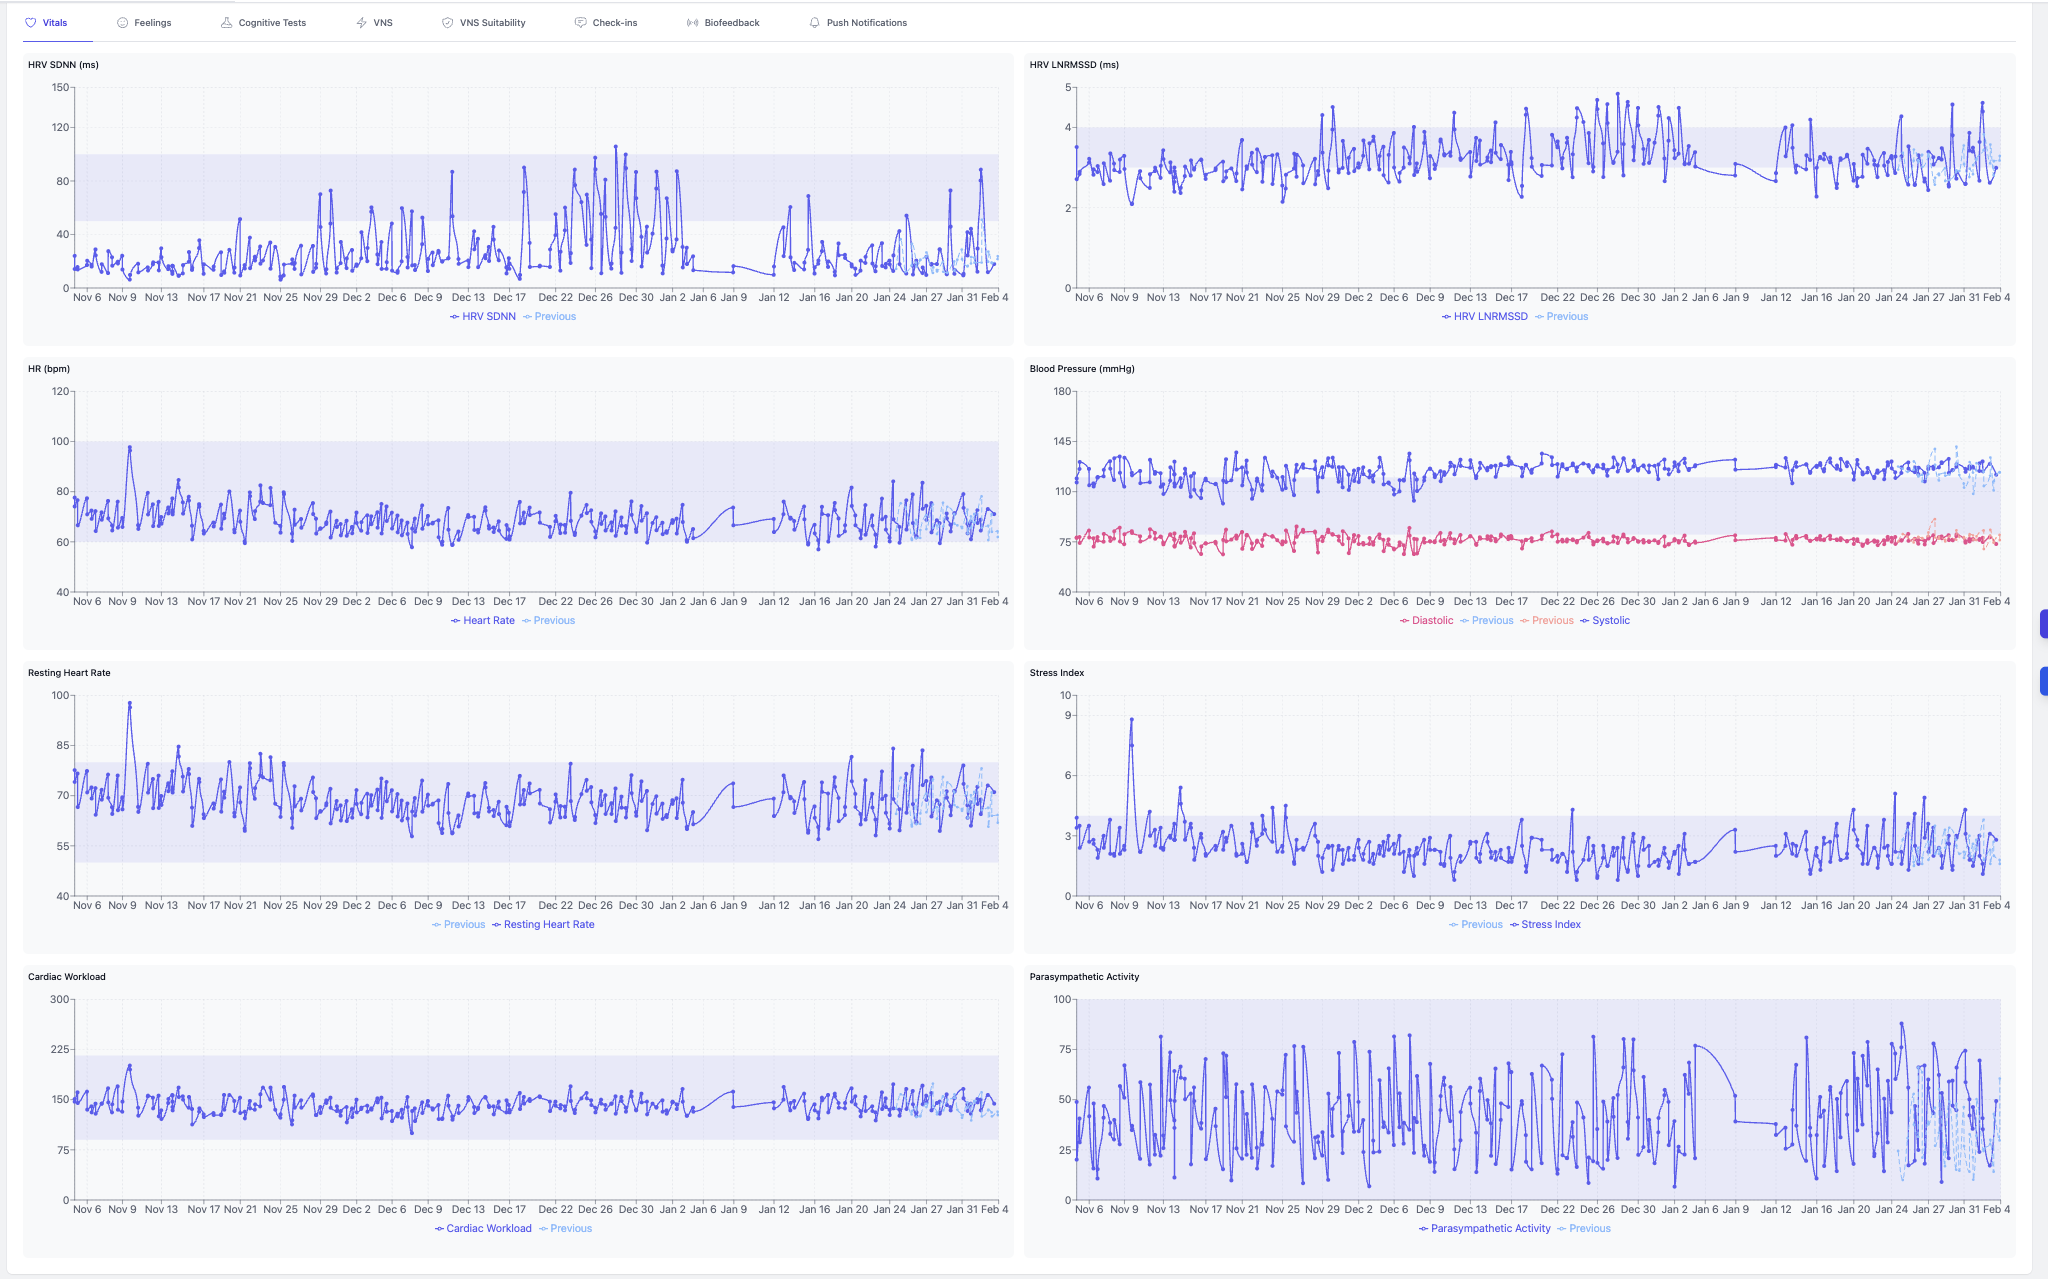
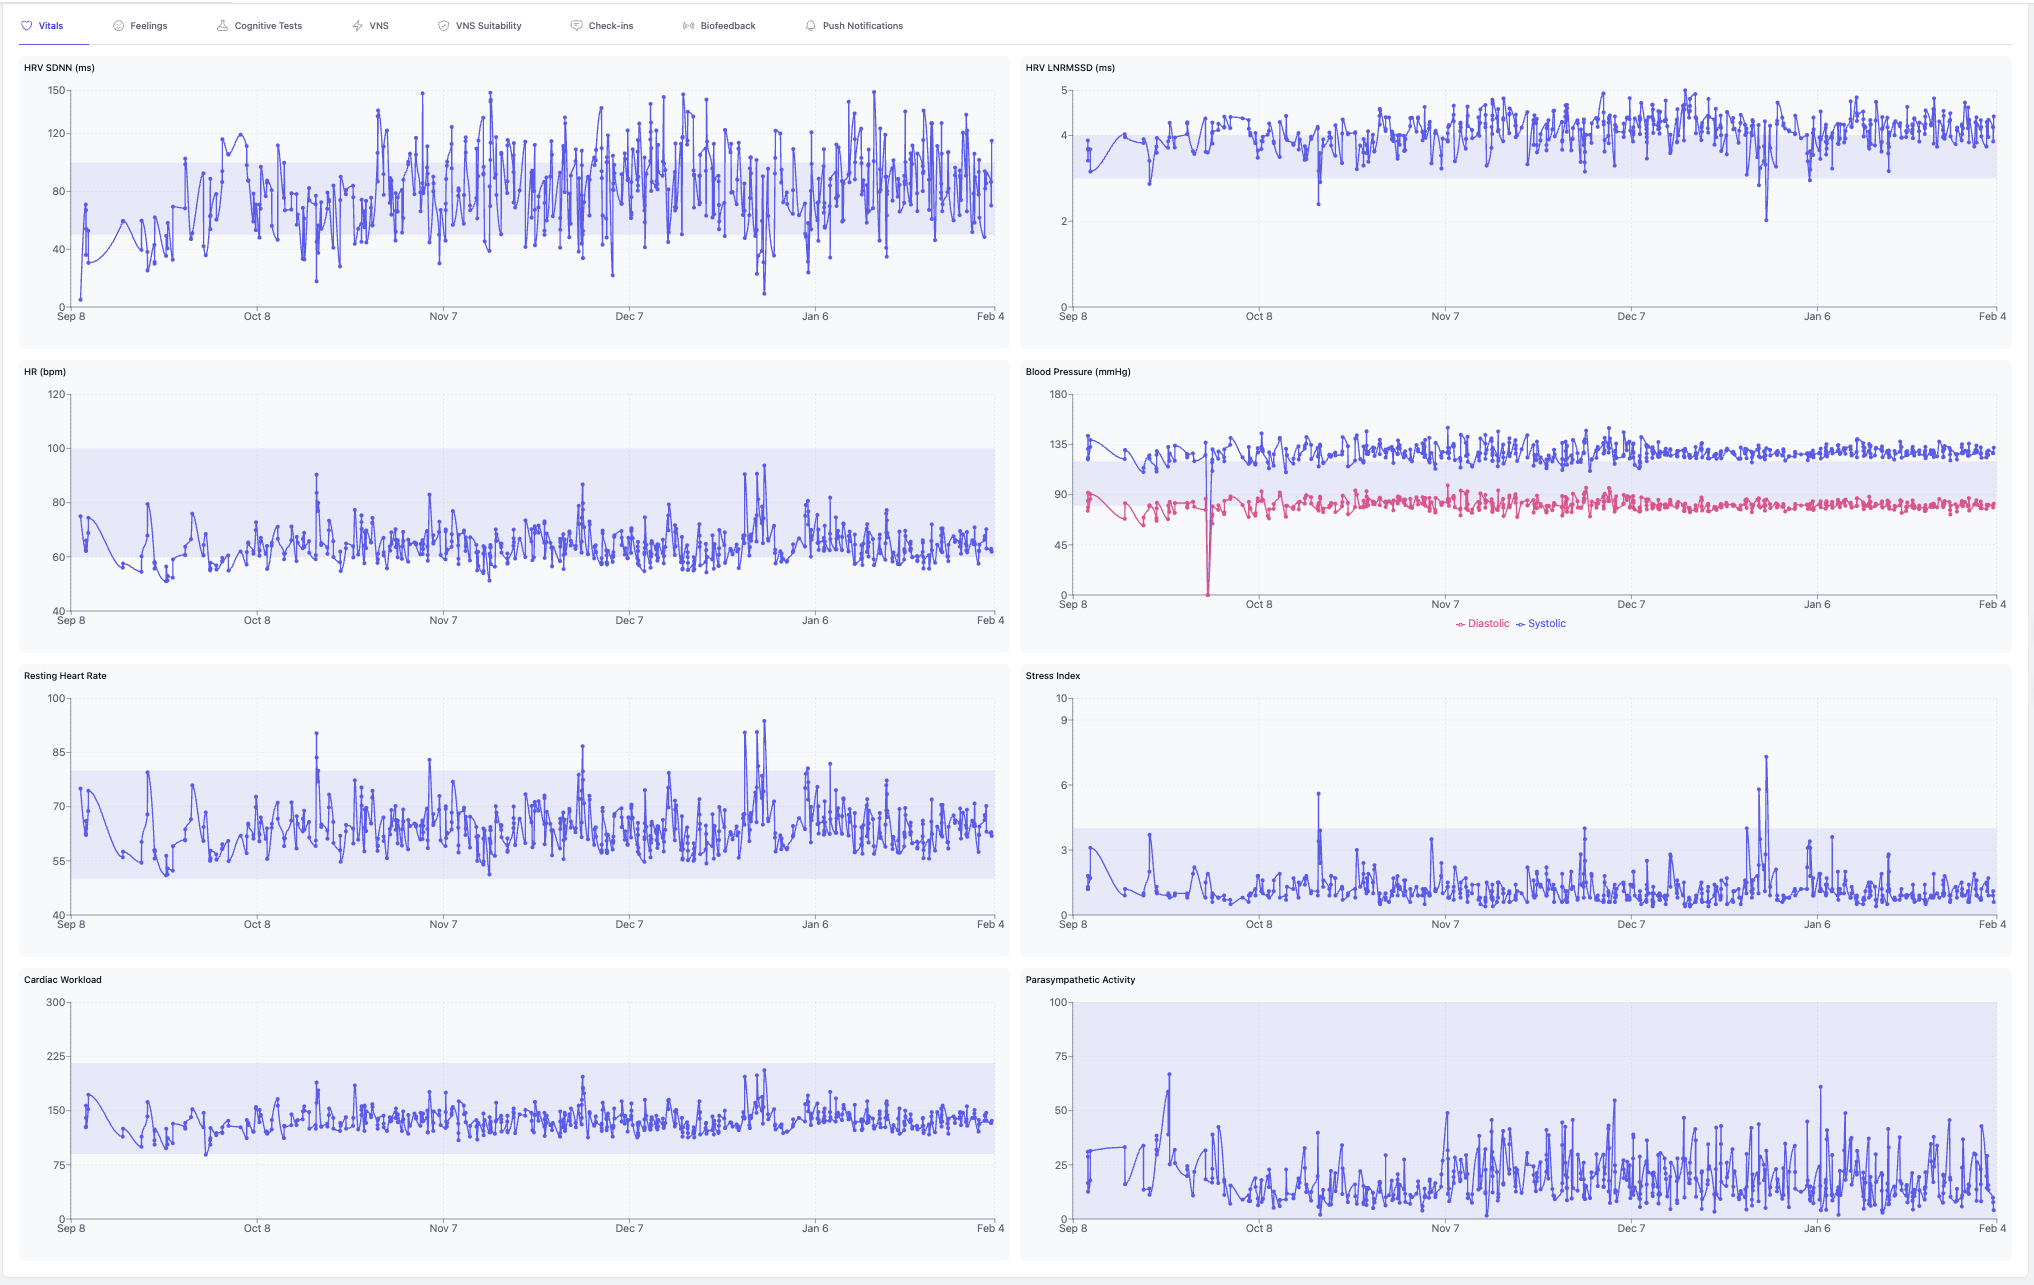
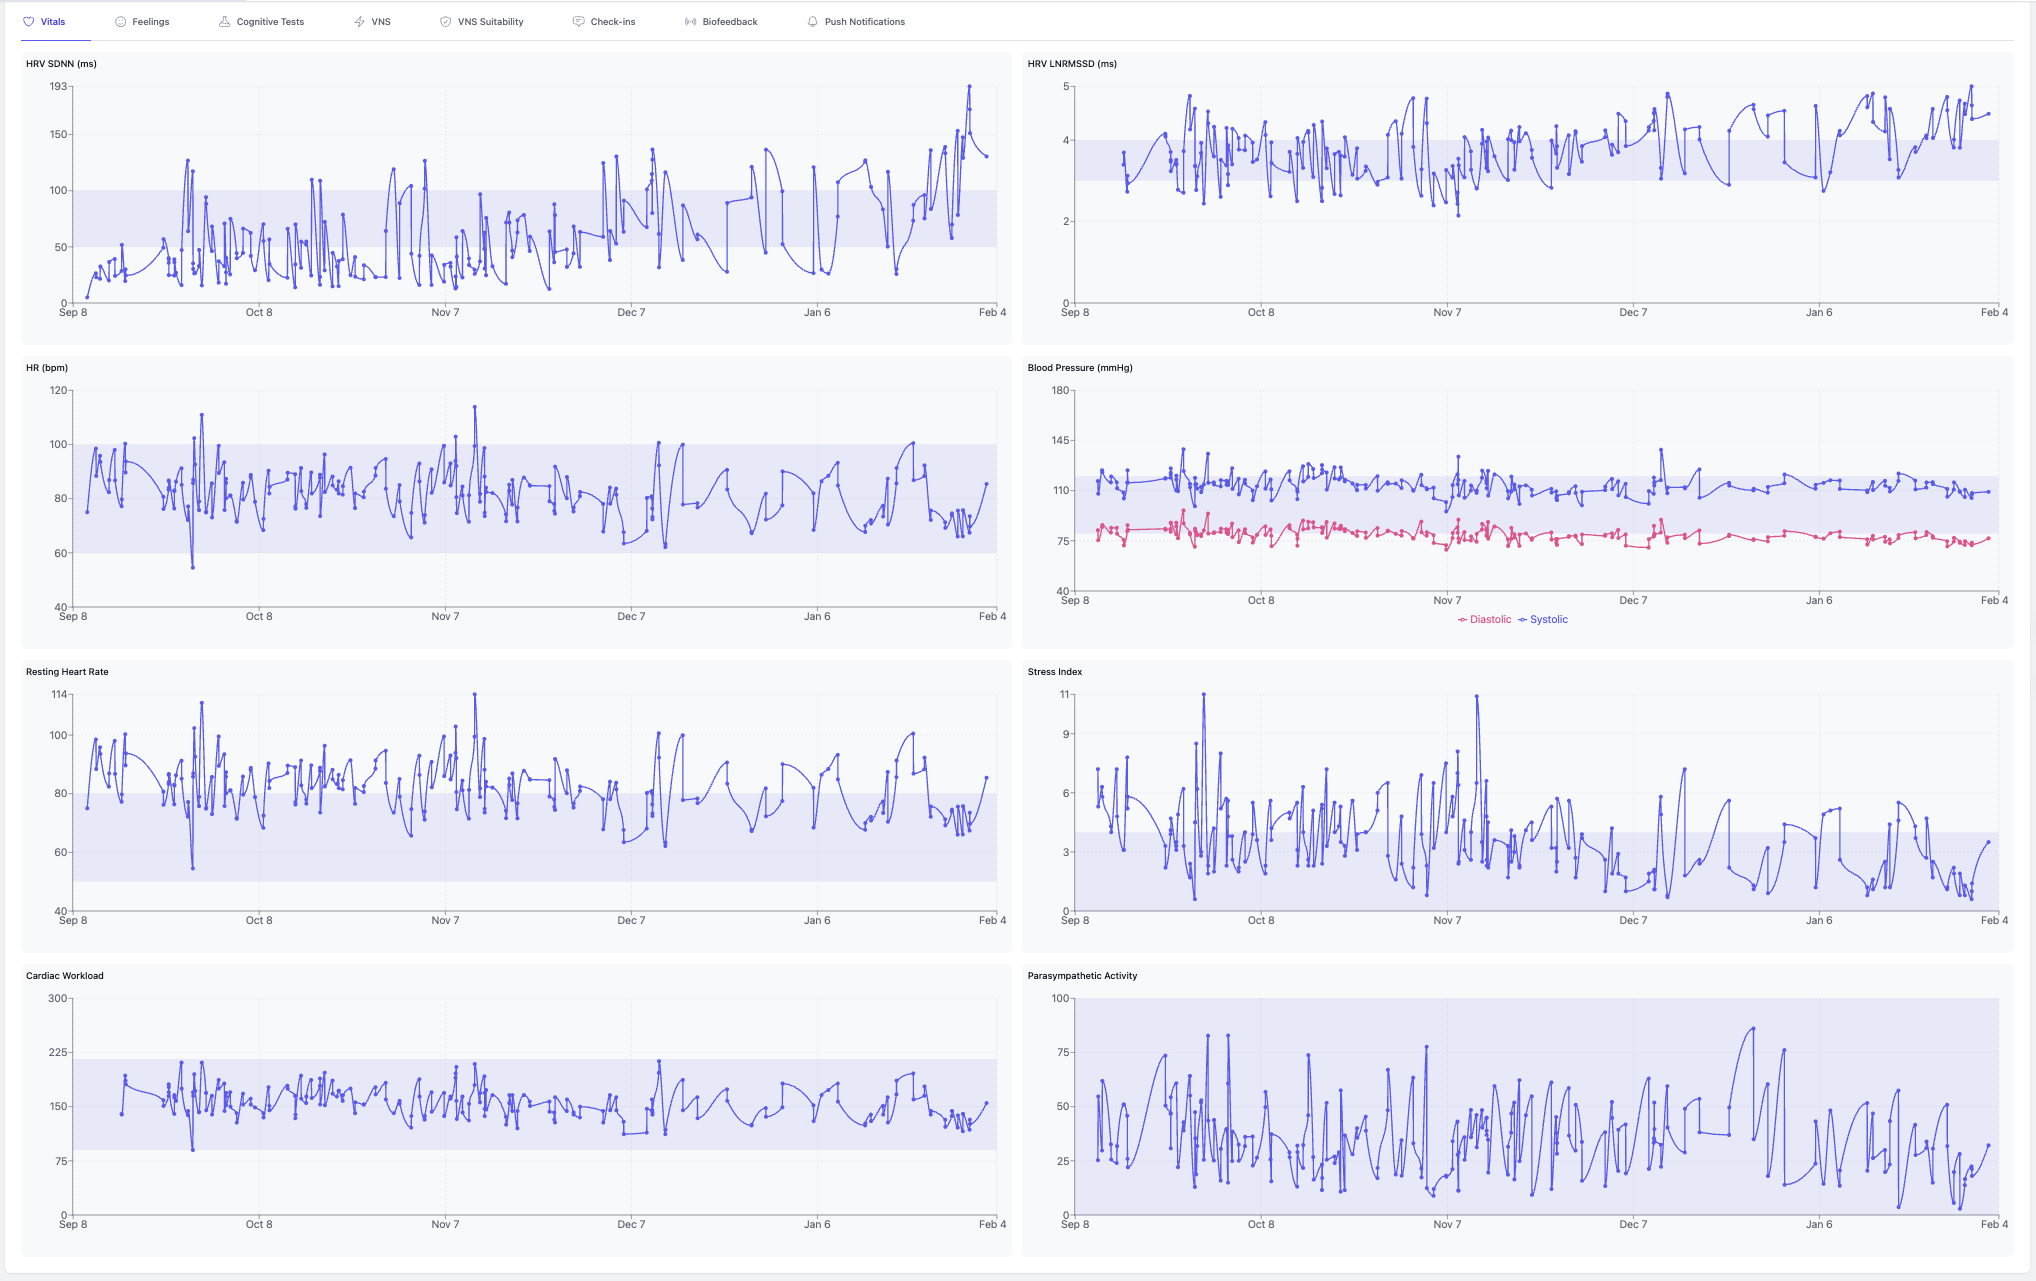
Eight biometric dimensions. Five months of daily data. Every tab represents a layer of insight your hardware currently doesn't capture.

User A — Nov 6 – Feb 4
User A vitals dashboard — 8 biometric dimensions, Nov 6 to Feb 4
User B — Sep 8 – Feb 4
User B vitals dashboard — 8 biometric dimensions, Sep 8 to Feb 4
User C — Sep 8 – Feb 4
User C vitals dashboard — 8 biometric dimensions, Sep 8 to Feb 4

Each panel shows one tab of eight. Behind "Vitals" sit Feelings, VNS dosing, Biofeedback sessions, Check-ins, and more — a longitudinal health record that doesn't exist anywhere else.

Sources: yōjō platform analytics (RMSSD measurements via rPPG face scan). Baseline defined as first 3 scans. Age-segmented analysis uses 6 age groups. HRV cohort segmentation uses RMSSD thresholds. All data from activated users with ≥5 recorded sessions. Gianlorenco et al. 2024: "Age as an effect modifier of taVNS on HRV."